CRM ANALYTICS

Revenue forecast and the whole pipeline. No third-party BI

Monthly and quarterly revenue forecast, a list of deals at risk and the exact pipeline bottlenecks — with no third-party BI. Sales and support in one product.

Forecast from a weighted pipeline · CSV export · launch from 2 hours

FORECAST · PIPELINE
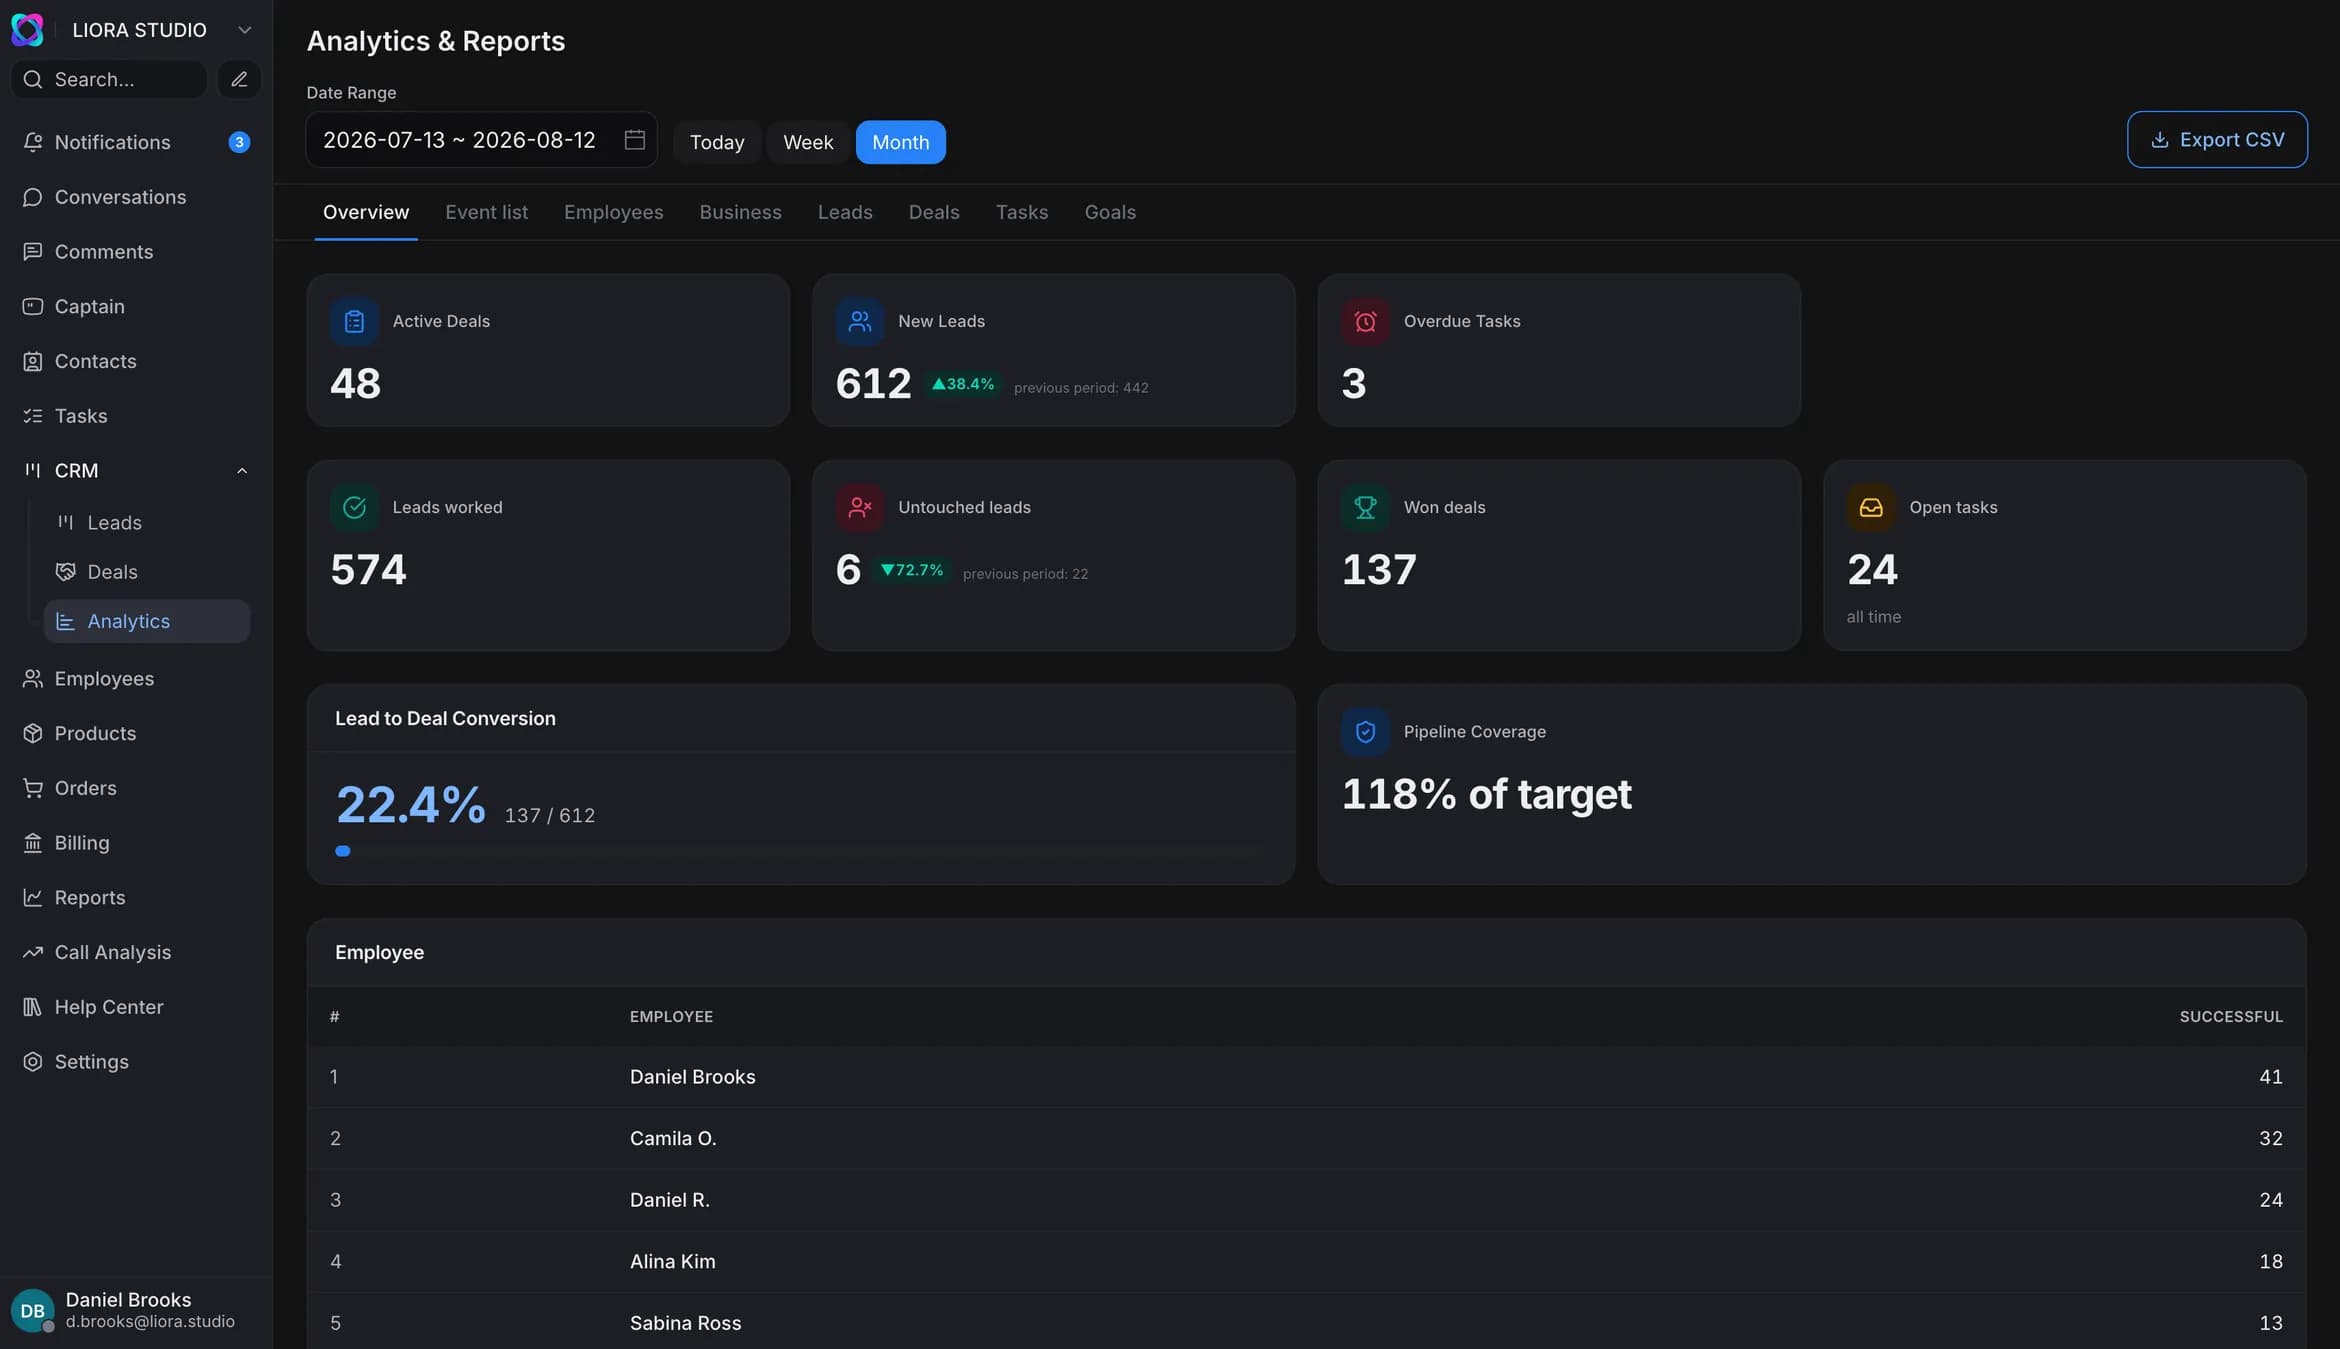
Screenshot · Revenue forecast: weighted pipeline and Pipeline Coverage
8core sales reportsmonth + quarterforecast horizonfrom 2 hoursto your first dashboards
WHAT YOU GET

Not charts for their own sake, but decisions

Every report answers a concrete sales-leader question — what to do today and whether you will hit the plan.

Know in advance if you will hit the plan

The weighted pipeline and Pipeline Coverage show expected close for the month and quarter — before the period ends, not after the fact.

Find the money stuck in the pipeline

Stale deals with no movement and pipeline value by stage — you see which deals to pick up right now.

Real reasons for losses

Loss reasons and Win/Loss breakdown — why you lose deals and at which stage, not guesswork.

How many hours AI saves

Automation Insights: number of AI actions, hours saved and success rate — automation ROI in numbers.

EIGHT SALES REPORTS

The full sales pipeline in one place

Eight core CRM reports — from the overall sales pulse to the revenue forecast. Each answers a concrete question.

Overview

Overview

Sales health for the period with auto-comparison to the previous one.

  • Revenue from won deals
  • Active deals and new leads
  • Overdue tasks
  • Lead→deal conversion
  • Top performers (leaderboard)

Answers the question: How are sales going this period overall? Who is best? Are we growing?

Leads

Leads

How leads move through the funnel and the quality of sources.

  • New and lost leads
  • Conversion funnel by stage
  • Breakdown by source
  • Stage-to-stage conversion (%)
  • Average time in stage

Answers the question: Where do the best leads come from? At which stage do we lose them? Why does the funnel stall?

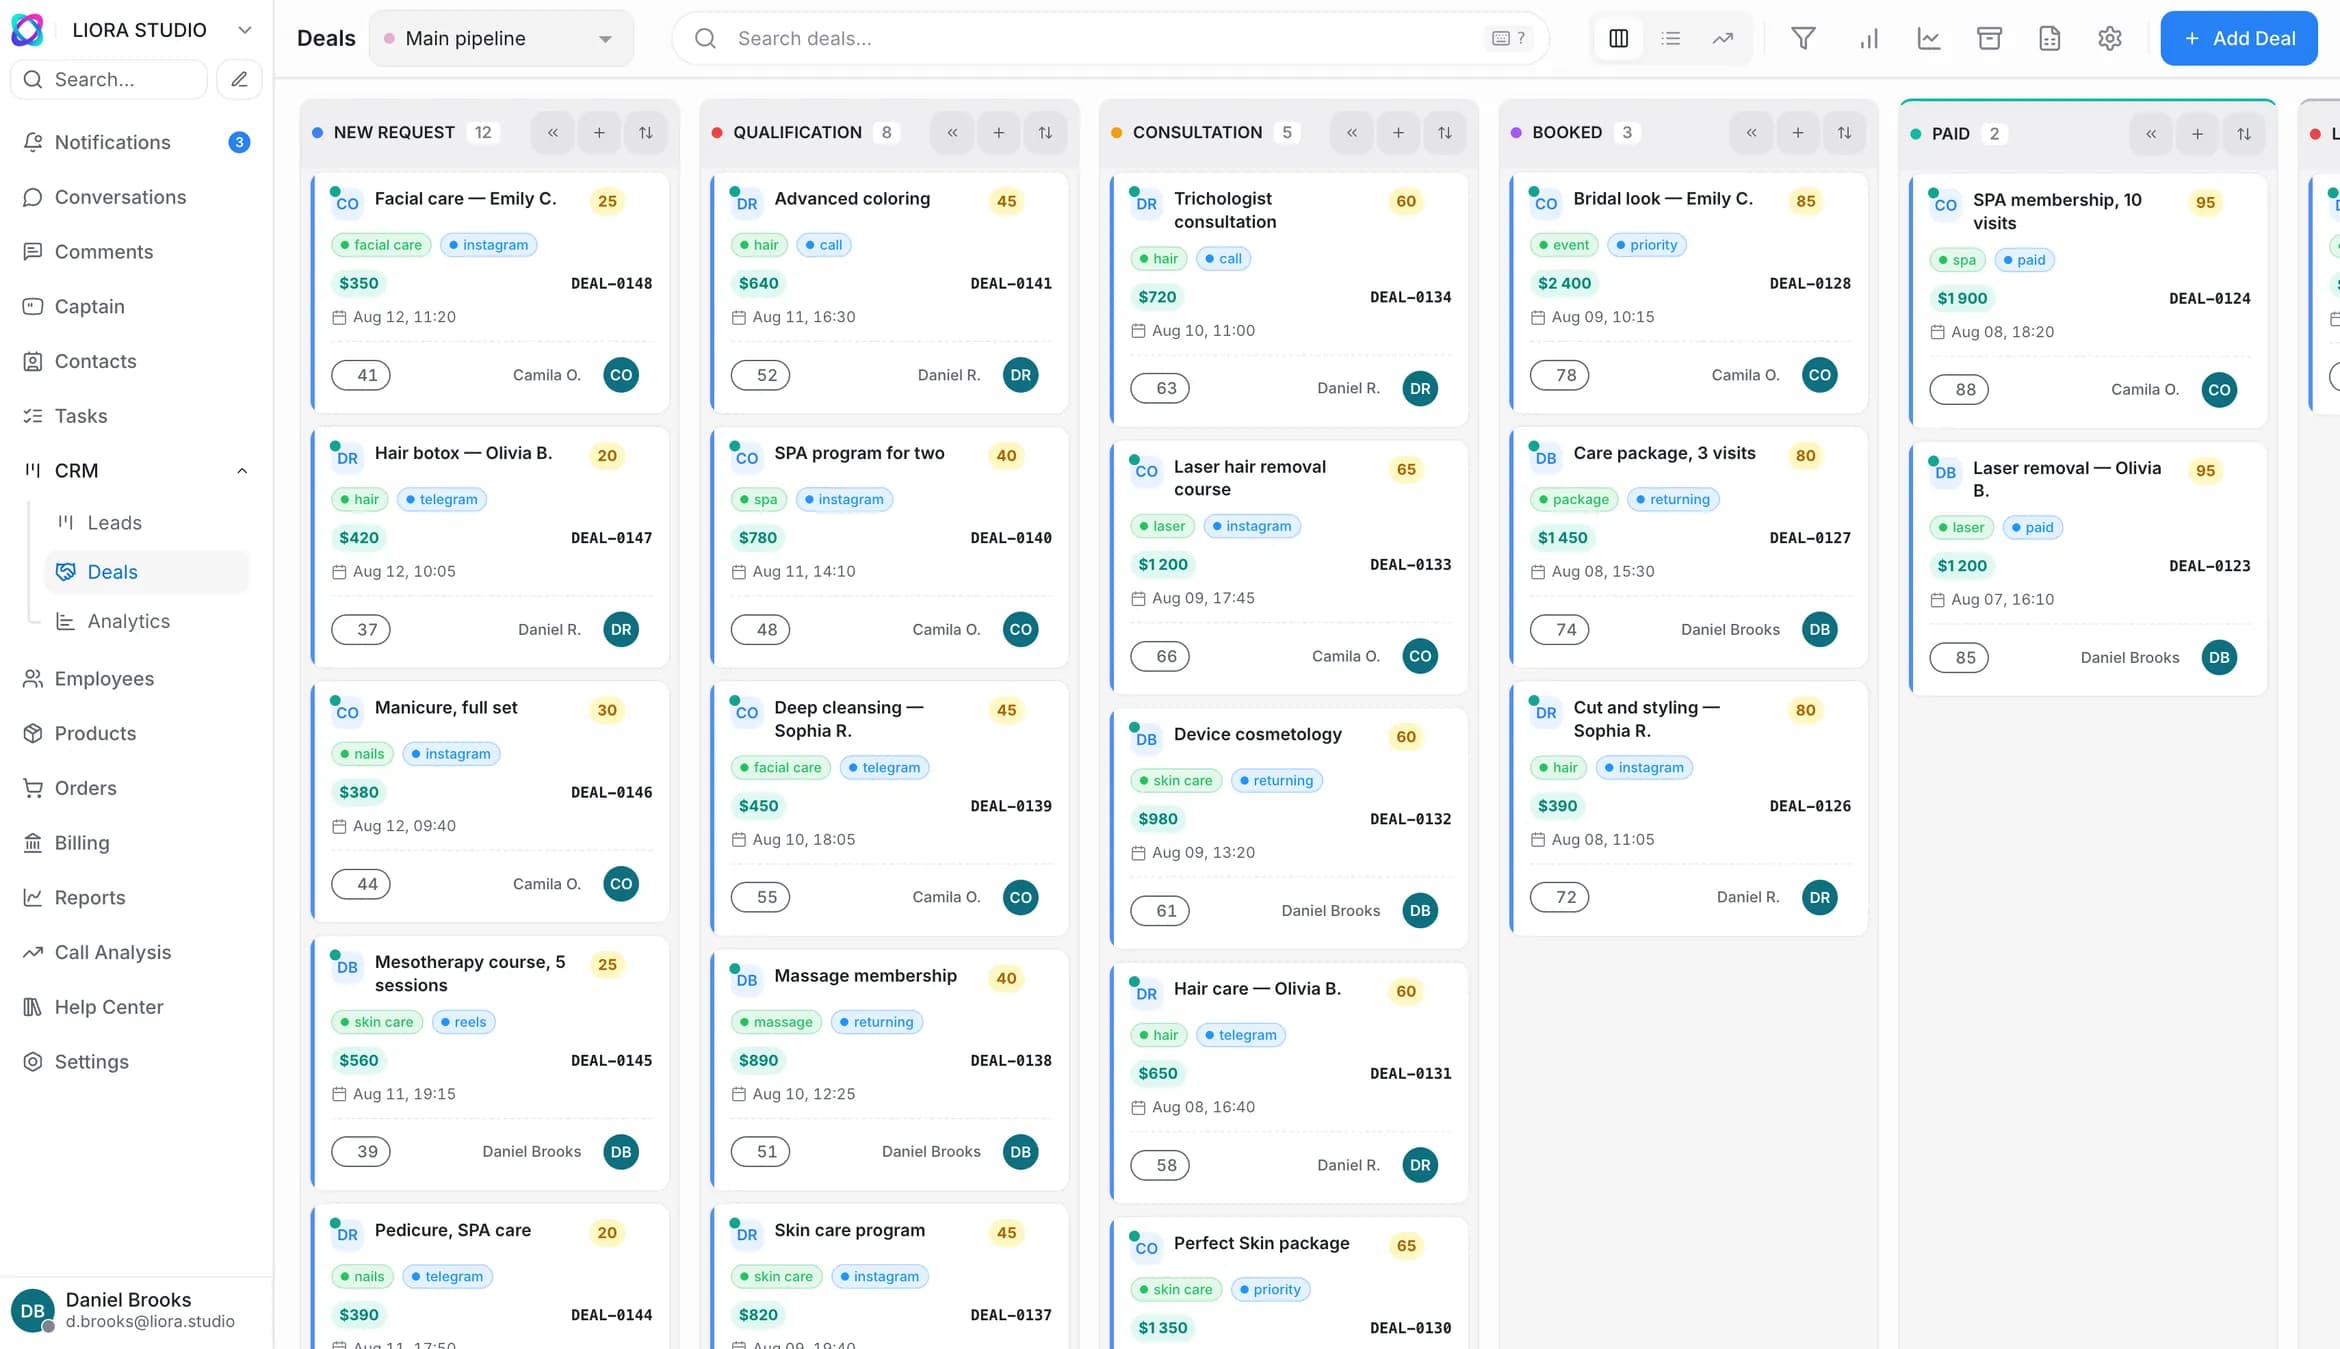
Deals

Deals

Pipeline value and health, and the reasons behind losses.

  • Open / won / lost, Win Rate
  • Pipeline value by stage
  • Loss reasons
  • Average deal size (trend)
  • Stale deals

Answers the question: How much money is in the pipeline? Why do we lose? Where is the money stuck?

Contacts

Contacts

Growth and distribution of the customer base across stages.

  • Total and new contacts
  • Contacts with deals
  • Distribution by stage
  • Base growth trend
  • New vs returning

Answers the question: Is the base growing? How long does it take to move a contact to a deal?

Tasks

Tasks

The team’s follow-up discipline and throughput.

  • Total / done / overdue
  • Completion Rate
  • Tasks by type: call, email, meeting
  • Overdue trend
  • Average completion time (h)

Answers the question: Are we keeping up with follow-ups? Who is productive and who is drowning in overdue tasks?

Activities

Activities

The link between the number of touches and deal outcome.

  • Total activities and Completion Rate
  • Activities per deal: won vs lost
  • Activity trend by type
  • Activity by employee

Answers the question: Are we working deals hard enough? How many touches lead to a win?

Goals

Goals

Plan vs actual for team and individual goals.

  • Number of goals and overall progress
  • Types: revenue / won deals / new leads
  • Plan vs actual per goal
  • Progress % in real time
  • Period: week / month / quarter

Answers the question: Are we on track to plan? Who is behind their goal?

Forecast

Forecast

Advanced analytics: weighted forecast and pipeline health — more below.

  • Weighted pipeline = Σ(amount × stage probability)
  • Expected close: month and quarter
  • Pipeline Coverage — plan coverage
  • Deals at Risk
  • Pipeline health: bottleneck, velocity

Answers the question: Will we hit the revenue plan? Which deals to save? Where does the funnel slow down?
REVENUE FORECAST

A forecast from the weighted pipeline. No black box

The forecast is computed from your actual deals: amount × stage probability plus historical conversion. Not an ML prediction — transparent pipeline arithmetic.

  • Weighted pipelineWeighted pipeline = Σ(amount × stage probability) — a forecast from facts, not gut feeling.
  • Expected closeHow much will close this month and quarter — before the period ends.
  • Deals at riskDeals at Risk — overdue and stale deals you need to pick up now.
  • Pipeline healthBottleneck stages with a criticality level, stage aging and pipeline velocity.
PIPELINE COVERAGE

How well the pipeline covers the plan

How many times the weighted pipeline covers the period target.

≥ 3×Buffer in place
≥ 1×Just enough
< 1×Not enough pipeline

Answers the question: Will we hit the revenue plan? Which deals to save? Where does the funnel slow down?
FORECAST · WEIGHTED PIPELINE
Screenshot · Weighted pipeline, expected close and deals at risk
AND THAT’S NOT ALL

Additional analytics cuts

Beyond the eight core reports — deep cuts for targeted decisions on the pipeline and deals.

Win / Loss Analytics

Win / Loss

Wins and losses with reason breakdown and comparison to the previous period.

Answers the question: Why do we win and why do we lose — and is it getting better?

Stage Conversions

Stage Conversions

Conversion and average time for each stage — in money and days.

Answers the question: Where is the funnel narrow and at which stage do deals sit longest?

Lead Pipeline Summary

Lead Pipeline Summary

One widget: total leads, conversion, average lead score, average deal cycle.

Answers the question: What is the summary lead picture at a glance?

Board Summary

Board Summary

Statistics for a specific task board and its statuses.

Answers the question: How loaded is a specific board and its statuses?

Deal Insights

Deal Insights

In the deal card: win probability, recommended actions, risk factors.

Answers the question: What is the probability of winning the deal and what to do now?

AI AUTOMATION INSIGHTS

AI works for you — and you see how many hours it saves

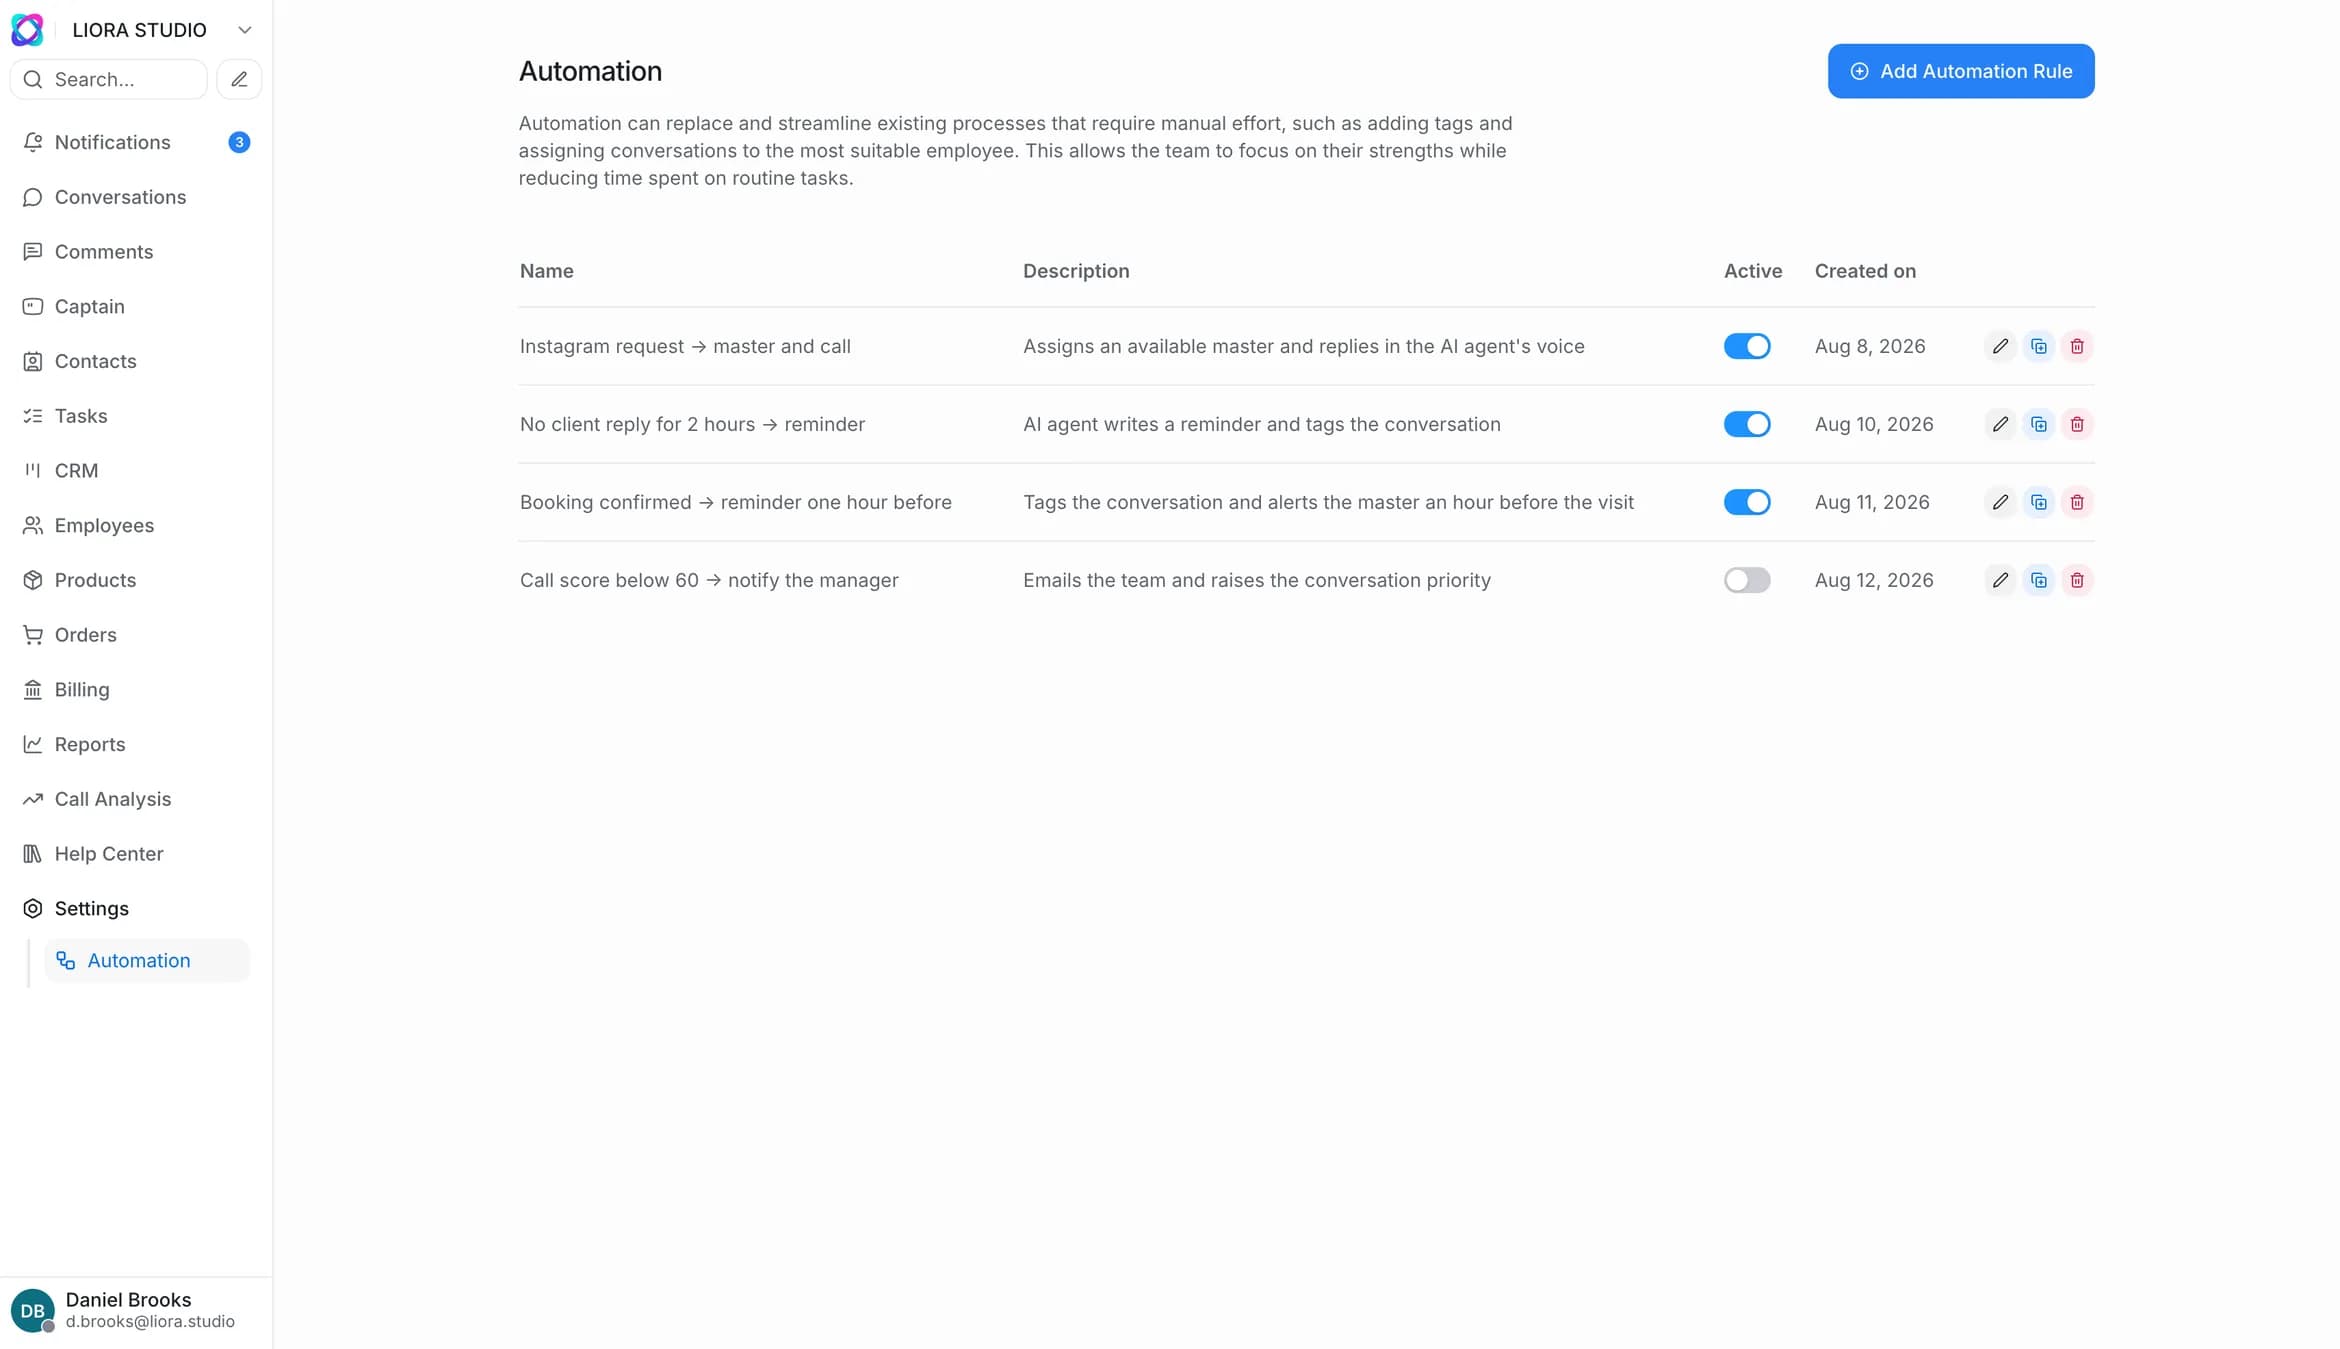
CRM automation clears the routine on tasks, leads and deals. Automation Insights shows the ROI of that work in numbers — how many actions and how much time.

AI actionstasks AI closed on its own
Hourstime saved for the team
Success rateshare of successful automations
  • Top automation rules — what fires most often
  • Cuts by tasks, leads and deals
  • Transparent resource spend on automation

Answers the question: How much does AI save and what is worth scaling?

More on AI automation
AUTOMATION · INSIGHTS
Screenshot · AI actions, hours saved and top rules
DATA YOU CAN TRUST

Flexible, fast and role-based access

Shared properties across all analytics — periods, export, cuts and role-based access. No need to reconfigure for every report.

Flexible periods

7 and 30 days, 3 / 6 / 12 months or a custom date range.

Grouping

By day, week, month and year — adaptive to the chosen period.

CSV export

For every report; heavy CRM exports are prepared in the background and arrive as an email link.

Cuts

By pipeline, stage, source, product and employee.

Role-based access

View, export and forecast separately — everyone sees their own.

The dashboard is fast

Data refreshes often and dashboards open instantly.

Q & A

Frequently asked questions about CRM analytics

How is the revenue forecast calculated?

From a weighted pipeline: each deal amount × its stage probability, plus expected close for the month and quarter. This is not an ML prediction or a black box — it is computed from your actual deals and historical stage conversion.

What is Pipeline Coverage?

How well the pipeline covers the plan — how many times the weighted pipeline exceeds the period target. ≥3× is green (buffer in place), ≥1× is yellow (just enough), <1× is red (not enough pipeline, you need new deals).

Can I export to CSV?

Yes, for every report. Heavy CRM exports are prepared in the background and arrive as an email link so you don’t have to wait at the screen.

Who sees the forecast?

Access is role-based — view, export and forecast separately. A manager sees the whole sales picture; a rep sees their own deals, tasks and goals.

Does AI show how much time it saves?

Yes. Automation Insights shows the number of AI actions, hours saved and the success rate of automations, plus the top rules that fire most often.

Is this a separate BI tool?

No. All analytics are built into Zukko.AI: sales and support in one product, no third-party BI. Launch for small and mid-size business — from 2 hours.

CRM ANALYTICS

See the revenue forecast on your own pipeline

Connect sales and support and get the forecast, deals at risk and pipeline bottlenecks — with no third-party BI. Launch from 2 hours.

Onboarding from 2 hours · CIS banks and large business — up to 30 days