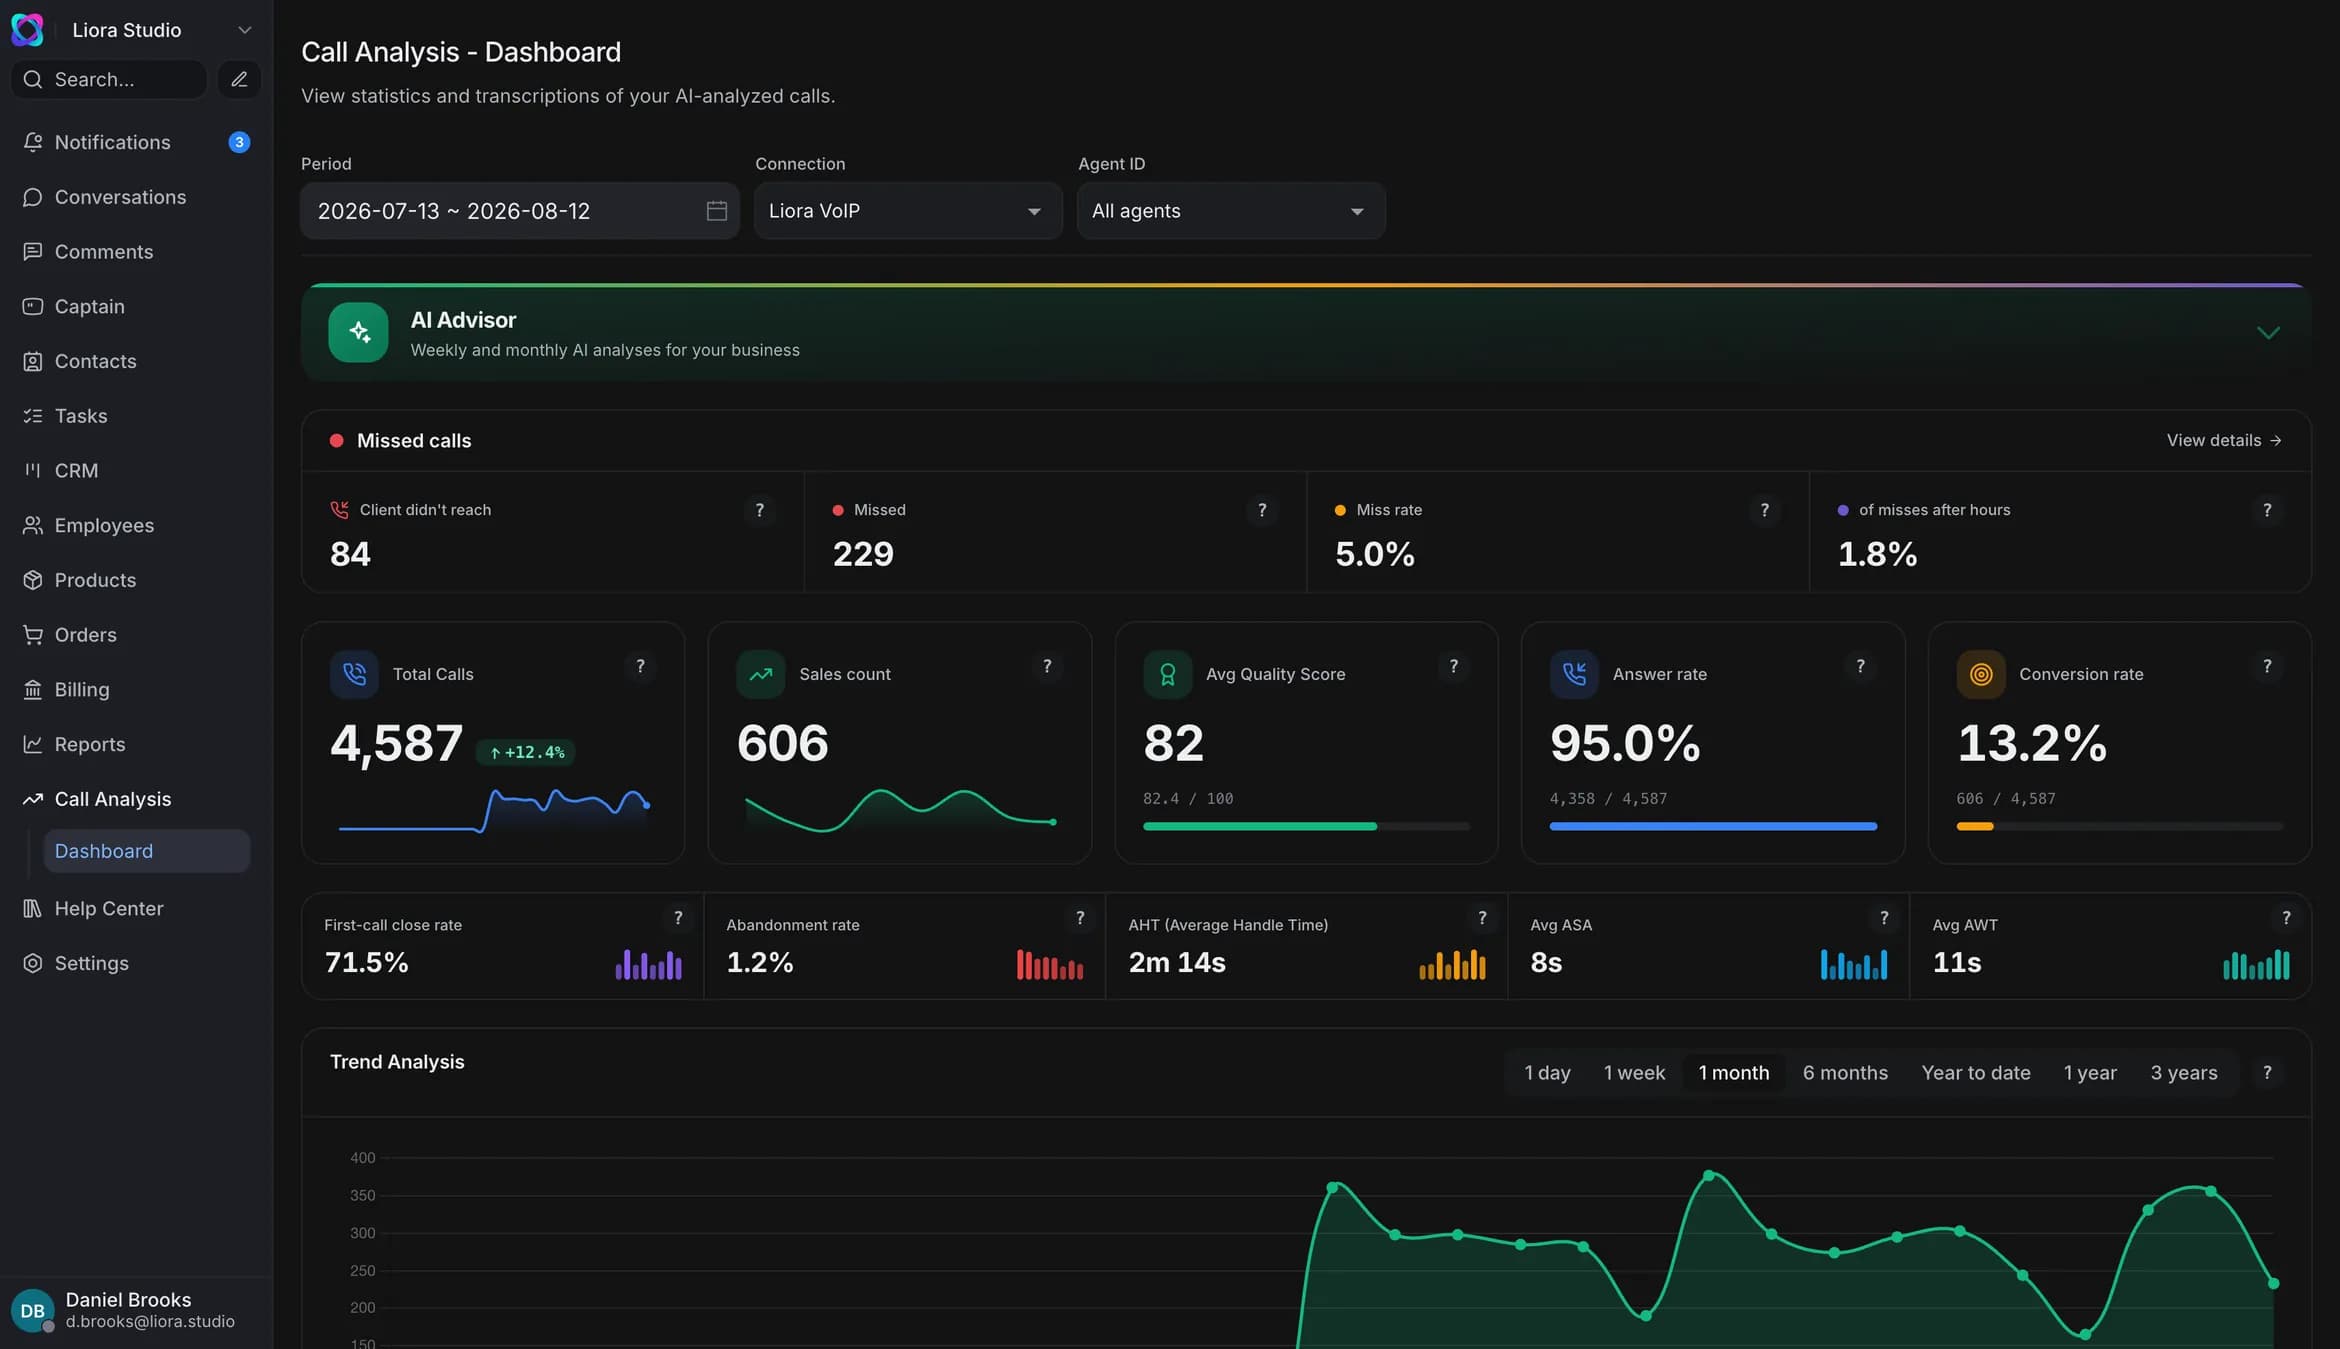
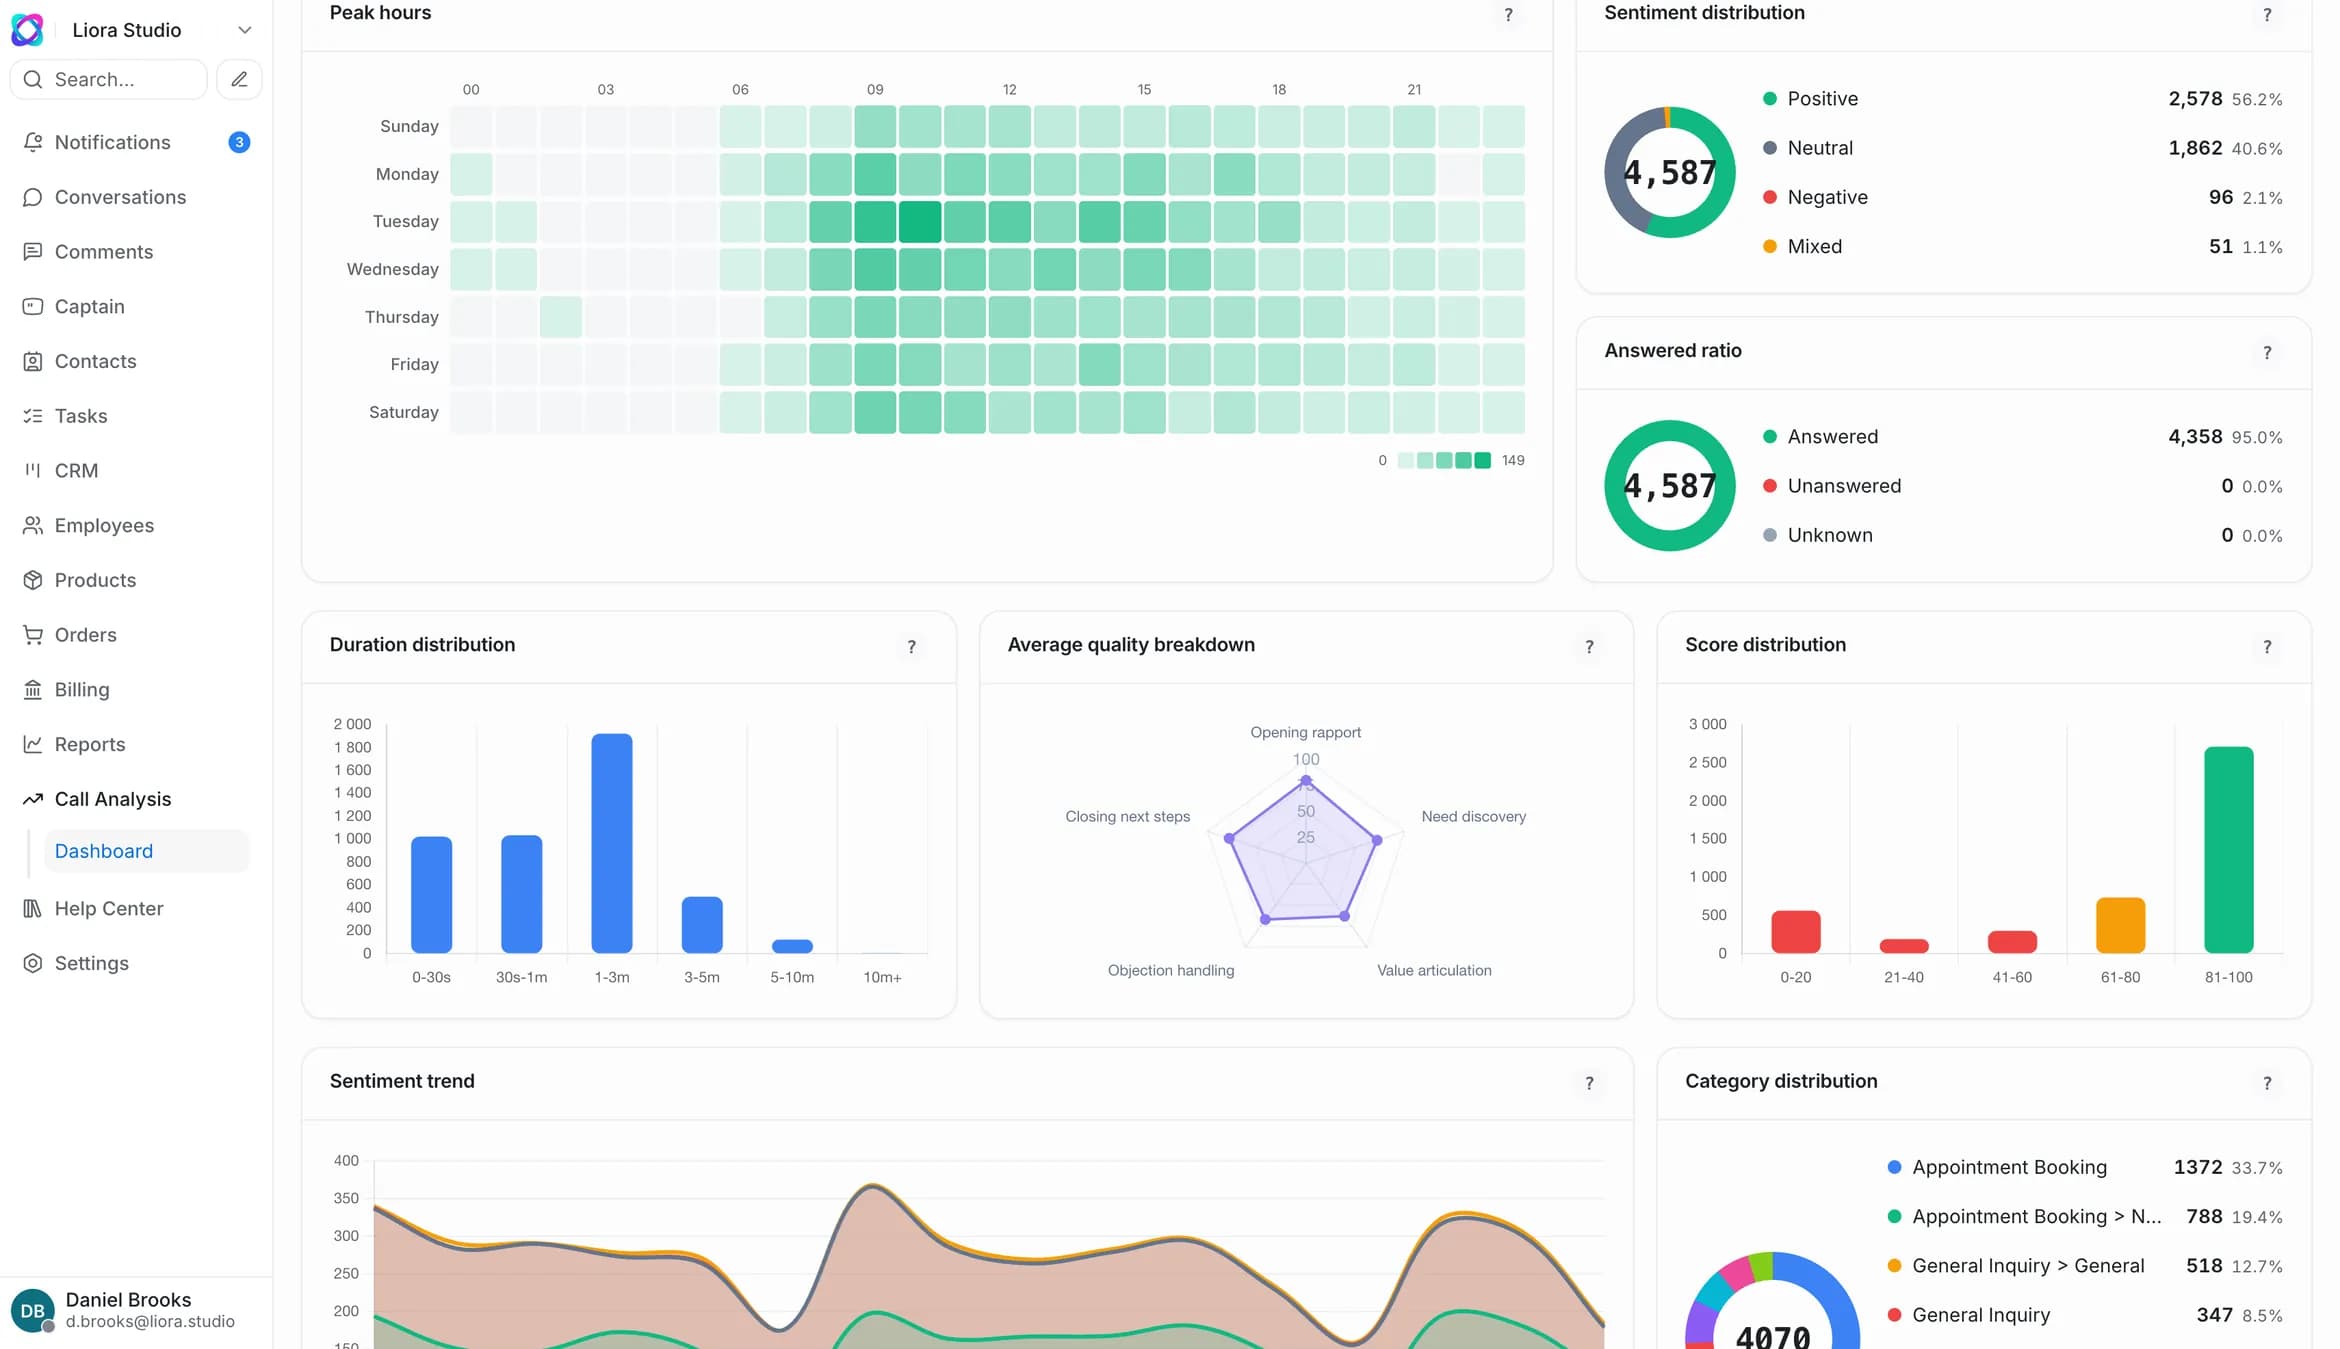
See bottlenecks in support before a customer complains — workload, speed, quality and SLA in one place. Nine reports on conversations instead of ten Excel exports.
100% of conversations in reports · self-service launch from 2 hours
app.zukko.ai
Screenshot · Live overview: queue, heatmap, agent statuses
9support reports in one place
9 reportson conversations and SLA100%of conversations, not a samplefrom 2 hoursto your first dashboards
WHAT YOU GET
Decisions, not charts for the sake of charts
Every report answers a support lead’s question instead of describing a button. Here is what changes in practice.
01
Staff the peaks, not the average
The workload heatmap shows conversation volume by day of week and hour — you schedule shifts for real peaks, not by gut feel.
02
Honest speed and SLA metrics
Business-hours accounting drops nights and weekends from the math: first response, resolution time and SLA Hit Rate — undistorted by off-hours idle time.
03
Objective view of agents and teams
Comparison by facts — volume, timings, resolved count. You see both the leaders whose practices to spread and those who need help.
04
Bot ROI in numbers
Bot resolution rate and handoff rate show how many conversations close without people and where scenarios need work.
NINE REPORTS
All of support in nine reports
From a live board right now to SLA control. Each report has its essence, key metrics and the question it answers.
app.zukko.ai
Screenshot · Live overview: queue, heatmap, agent statuses
Live overviewOverview
A manager’s live board: what is happening in support right now
Open conversations: Open, Unattended, Unassigned, Pending
Workload heatmap — volume by day of week and hour (24 h)
Conversations by agent — open and unattended for each
Conversations by team — the same, by team
Agent status — Online / Busy / Offline right now
Answers the question: Is everything under control now? Who is overloaded? Which hours need more people?
ConversationsConversations
Aggregate trend of support volume and quality over time
Total conversations, incoming and outgoing messages
Average first response time (First Response Time)
Average resolution time (Resolution Time)
Resolved count (Resolution Count)
Customer wait time (Reply Time)
Answers the question: Are we answering faster or slower than a month ago? Are we keeping up with the growing load?
Agent performanceEmployees Overview
Comparison of agents and a detailed page for each
Conversation count, avg first response and resolution time
Avg customer wait time and resolved count
Click a name → that agent’s personal trend
Fair workload distribution based on facts
Answers the question: Who performs, who needs help, how to distribute work by fact rather than by guess?
Channel analyticsInbox Overview
Performance of each channel: email, chat, social, messengers
Conversation volume for each channel
First response and resolution time by channel
Customer wait time and resolved count
Click a channel → its trend over time
Answers the question: Which channel performs better? Where do customers wait the longest?
Topic (tag) analyticsTags Overview
Grouping conversations by topic and category through tags
Conversation volume per tag
Response and resolution timings by topic
Resolved count for each tag
Answers the question: What do customers contact us about most, and what takes longest to resolve?
Team performanceTeam Overview
Comparison of teams against each other, plus per-team detail
Volume and timings for each team
Resolution and customer wait time
Resolved count by team
Answers the question: Which team performs better and why? Where should the structure change?
Customer satisfaction (CSAT)CSAT Reports
Direct feedback from customers after a conversation
Total responses
Satisfaction score = positive / all × 100
Response rate = responses / surveys sent × 100
Rating distribution — visual, by emoji
Response table and filters: contact, agent, rating, channel
Answers the question: Are customers happy? Which of them to win back? Which agents delight customers?
Answers the question: Does the bot pay off? What share of requests does it take off people?
SLA controlSLA Reports
How well reaction and resolution deadlines are met
Hit Rate — share of SLAs met successfully
Number of Misses — breaches over the period
Number of Conversations — conversations under SLA
Breach table: policy, channel, agent, tag, team
Answers the question: Are we keeping our deadline promises? Where and through whose fault does SLA break?
WHY YOU CAN TRUST THE DATA
One dataset, many angles
Shared properties of all support reports — flexible periods, honest time accounting and careful access.
CSATSCOREDIST
Screenshot · CSAT: satisfaction score and rating distribution
Flexible periods7 days, 30 days, 3, 6 or 12 months, or a custom date range.
GroupingBy day, week, month and year — adaptive to the chosen period.
Business-hours accountingA “business hours only” toggle for honest SLA and speed metrics.
CSV exportEvery report exports to CSV — data ready for your own workbook.
BreakdownsBy agent, team, channel and tag — comparison from the angle you need.
Role-based accessOnly authorized users and administrators can see the reports.
FAQ
Frequently asked questions about support reports
What is business-hours accounting?
A “business hours only” toggle: speed and SLA metrics are calculated without nights and weekends. The picture is honest, not inflated by off-hours idle time.
How is CSAT calculated?
Satisfaction score = positive ratings / all responses × 100, response rate = responses / surveys sent × 100. Plus a rating distribution and a filterable feedback table.
Can I export SLA breaches?
Yes. Every report, SLA included, exports to CSV, and the breach table can be filtered by policy, channel, agent, tag or team.
What does bot performance show?
Bot conversation count, bot resolution rate (bot-resolved / total conversations × 100) and handoff rate to an agent. You see what share of requests the bot takes off people and where to improve scenarios.
Who sees the reports?
Role-based access: reports are open only to authorized users and administrators, not to regular agents.
What period can I view data for?
7 days, 30 days, 3, 6 or 12 months, or a custom range, grouped by day, week, month or year.
How do support reports differ from CRM analytics?
Support reports are about conversations and the contact center: workload, speed, quality, SLA. CRM analytics is about sales: funnel, deals, revenue forecast. The two systems are separate but live in one product.
SUPPORT REPORTS
See bottlenecks before a customer complains
Connect your channels and get nine reports on conversations. Self-service launch — from 2 hours; for large businesses and CIS banks — up to 30 days.